


Cost Segregation Study Methods
Table Of Contents
 By Jason Watson, CPA
Posted Sunday, July 12, 2026
Now that we know why cost segregation is allowed, let’s talk about how the study is prepared. Said differently, who decided that $60,000 of your $300,000 building value belongs in shorter-life property? Was it an engineer? A cost database? A software model? A spreadsheet with a dream? We love dreamy spreadsheets.
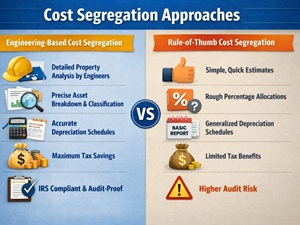
Cost segregation is a spectrum. There are detailed engineered studies, residual estimation studies, sampling or modeling approaches, survey-based approaches, and some sketchier “rule of thumb” approaches. According to IRS Publication 5653 Cost Segregation Audit Techniques Guide (ATG), no single required format exists for all cost segregation studies, but the methodology, source data and reconciliation still matter.
For most rental property owners, however, the two methods you will hear about most often are-
- Fully engineered cost segregation study
- Residual estimation method
There are variations and hybrids, of course, because tax people and engineers cannot leave things alone. But these two categories cover most of what real estate investors are comparing when they ask, “Do I need the expensive study, or can I use the cheaper one?”
Fully Engineered Cost Segregation Study
A fully engineered cost segregation study is the more detailed approach. Think virtual or in-person site visit, photographs, measurements, construction knowledge, cost estimating and a report that feels closer to an engineering appraisal than a tax software printout.
This method is strongest when actual construction records exist, but they are not always required. For new construction, substantial renovations, build-outs, additions or major rehab projects, the engineer or analyst might review contractor invoices, architectural drawings, engineering plans, site plans, change orders, specifications and other project records. All the usual suspects.
A fully engineered study can also be used for acquired property, especially when the building is larger, complex, unusual, commercial, mixed-use or loaded with improvements. In that case, the analyst often estimates component costs using site observations, photos, measurements, construction-cost databases and professional judgment.
The big benefit is support and precision. Engineering-based cost segregation studies can sometimes identify more 5-, 7- and 15-year property than a statistical or residual method because it is looking more closely at the actual property instead of leaning as heavily on averages. That does not automatically make it “better” in every case. It simply means the ceiling might be higher when the facts support it.
The downside? Cost and time. Shocking. People with clipboards, construction expertise and professional judgment tend to cost more than a web form with an algo.
A fully engineered study generally makes more sense when-
- The property is larger or more expensive,
- The building is commercial, mixed-use or unusual,
- There were substantial renovations or improvements,
- Actual construction records are available,
- The expected tax benefit is large (and therefore the “extra” depreciation found moves the needle), or
- You want stronger support because you enjoy sleeping at night.
Having said all this which is mostly historical and therefore conventional wisdom, a fully-engineered cost seg study is becoming more and more affordable. Providers are finding efficiencies with technology, virtual site visits, better data and, yes, AI.
Is a fully engineered study always required? No. Is it often the stronger and cleaner approach? Yes. Does it usually identify more property eligible for accelerated depreciation? In our experience, yes.
Residual Estimation Method
The residual estimation method is usually faster, less expensive and often very practical for less expensive or simpler rental properties. This is the method many lower-cost residential cost segregation products use, including many do-it-yourself (DIY) or software-assisted reports.
Instead of rebuilding the property cost from detailed construction records, the residual estimation method generally starts with the total purchase price or depreciable basis, removes land, estimates the value of shorter-life property, and leaves the remaining value in the building bucket.
Said differently, it starts with the whole pie, carves out the 5-year, 7-year and 15-year slices, and leaves the rest as 27.5-year or 39.0-year property.
For example, if your rental property has $300,000 of depreciable building value after land is removed, the residual estimation method might use property type, square footage, age, location (zip code or neighborhood), photos including listing photos, surveys, cost databases, user-provided information and prior studies to estimate how much belongs to appliances, flooring, cabinetry, landscaping, fencing, patios, sidewalks and other shorter-life components.
This can be perfectly reasonable for an ordinary single-family rental, condo, duplex, small multifamily property or standard short-term rental. If the property is simple and the expected tax benefit is modest, a fully engineered study might not pencil out. We like tax deductions, but we also like cash.
That said, residual estimation still needs support. It is not a license to make up percentages until the deduction feels tasty. A good residual estimation report should explain the inputs, assumptions, data sources, cost estimates, asset classifications and reconciliation back to the total depreciable basis.
Which Method Should You Use?
The answer depends on the property, expected tax benefit, available records and your tolerance for IRS exam friction.
A fully engineered study usually makes more sense when the incremental fee is justified by better documentation, stronger support, and the possibility of identifying more short-life property. Historically, this meant larger, more complex, commercial or heavily renovated properties. That is still true, but fully engineered reports have become more affordable, and the price gap between a residual estimation report and a fully engineered report is not always massive.
A residual estimation method can still make perfect sense for smaller, more standard residential rentals where cost, speed and simplicity matter. But it should not be viewed as the automatic answer for every single-family rental, condo, duplex or ordinary short-term rental.
If a fully engineered report costs only modestly more and identifies 5% to 6% more eligible short-life property, the additional depreciation can quickly justify the higher fee. But the answer depends on your tax rate and how you measure payback.
Here is a simple example. Assume the fully engineered report costs $2,000 more. If the fully engineered study identifies 6% more property eligible for accelerated depreciation, we’ve calculated the rough break-even math (and it’s arguably low)-
| Marginal Tax Rate | Extra Depreciation Needed To Cover $2,000 |
Depreciable Building Basis Needed At 6% Lift |
| 24% | $8,333 | $138,889 |
| 32% | $6,250 | $104,167 |
| 35% | $5,714 | $95,238 |
| 37% | $5,405 | $90,090 |
Said differently, at a 24% marginal tax rate, you need about $8,333 of additional accelerated depreciation to cover a $2,000 incremental report cost. If the fully engineered report identifies 6% more eligible property than the residual estimation method, that break-even point occurs around $139,000 of depreciable building value. To be certain, this is a low number, which is why fully-engineered cost segregation studies are becoming common on smaller properties. Not just for the rich and shameless anymore.
Keep in mind this table compares the extra fee to gross first-year tax savings, which is a simplification. Because cost segregation accelerates deductions rather than creating new ones, the truer measure is the time value of pulling those deductions forward, which we cover in the next section
At higher tax rates, the break-even point is even lower. At a 35% marginal tax rate, you only need about $5,714 of additional accelerated depreciation, which means a property with about $95,000 of depreciable building value could theoretically cover the $2,000 delta.
The key is not “engineered good, residual bad.” That is too simplistic. Cost segregation is not binary. It is a spectrum. A great residual estimation report can be better than a sloppy engineered report. A detailed engineered cost segregation report can be worth every penny on the right property. A cheap report with vague percentages and no reconciliation can be trouble regardless of what label someone slapped on the cover.
The table above only compares the incremental cost of one study method over another. That is useful, but it is not the whole question. Separate from choosing residual estimation versus fully engineered, we still need to ask whether doing cost segregation at all makes economic sense.
Does A Cost Segregation Study Pay For Itself?
Separate from which study method you choose, cost segregation still needs to pencil out. We like to compare the report fee to the economic value of the accelerated tax savings, using your expected inflation-adjusted return or cost of equity. For example, if the study creates $30,000 of tax savings and your return assumption is 6%, the one-year value of having that cash today is about $1,800.
Naturally, we still want some cushion since state addbacks, cost segregation timing and alignment to income, future recapture upon (your anticipated holding period) and other tax weirdness can change the answer. But as a rough rule, we like to see the cost segregation report paid back within one year using that time-value benefit. If the math takes five years to work, the study might still be technically correct, but not terribly compelling.
Next, we will take these methods and talk about how the actual cost segregation report turns into depreciation schedules, asset classes and tax deductions. After that, we’ll talk about do-it-yourself cost segregation reports, because yes, that is its own adventure.
Jason Watson, CPA, is a partner and the CEO of WCG CPAs & Advisors, a boutique yet progressive tax, accounting and rental property consultation and real estate CPA firm with over 100 team members and 7 partners headquartered in Colorado serving real estate investors worldwide.


I Just Got A Rental, What Do I Do? 2026 Edition
 This KB article is an excerpt from our 530+ page book (yeah, thick, there are some picture pages, but no scratch and sniff) which was updated August 5, 2026, and is available in paperback from Amazon, as an eBook for Kindle and as a PDF from ClickBank. We used to publish with iTunes and Nook, but keeping up with two different formats was brutal. You can cruise through these KB articles online, click on the fancy buttons below or visit our webpage which provides more information.
 |
 |
 |
| $32.95 | $21.95 | $18.95 |






Chat With a Tax Pro
Taxes can be tricky. Chat with a WCG human now and get questions answered.